The download above may not be suitable for users of assistive technology. For that reason, we have also included the contents of the report on this webpage.
The Equality Act 2010 (Specific Duties and Public Authorities) Regulations 2017 introduced a statutory requirement to produce information outlining details of any gender pay differences that exist within an organisation. As from April 2018 public, private and voluntary sector organisations with 250 or more employees were required to report on their gender pay gaps using six different measures.
This is the seventh report and is based on a snapshot date of 31 March 2024. We are required to publish data on the Government Equalities Office website and on the Trust website by 30 March 2025 and annually going forward.
The gender pay gap shows the difference between the average (mean or median) earnings of men and women. This is expressed as percentage of men’s earnings for example, women earn 15% less than men.
The gender pay gap differs from equal pay in the following way: Equal pay deals with the pay differences between men and women who carry out the same jobs, similar jobs or work of equal value. It is unlawful to pay people unequally because they are a man or a woman. The gender pay gap shows the differences in the average pay between men and women.
The following report includes the statutory requirements of the gender pay gap reporting legislation along with further context to demonstrate our commitment to equality.
Pay gaps can negatively affect the retention of the NHS workforce. They can make it harder to recruit and can have a detrimental impact on staff experience when in post.
The Trust is committed to understanding any differences identified in the gender pay report and will undertake further analysis to gain a better understanding as to the reason for the differences and to take action where appropriate.
Finally, it is important to note that analysis of pay gaps are multi-dimensional and complex. Undertaking pay gap reports helps us to identify where pay differences exist and identify actions to understand those disparities better. Reporting annually is an important step to allow us to see how our pay disparities are changing.
The gender profile of the Trust 2024
- Female: 80.0%
- Male: 20.0%
The gender profile split in the Trust has changed by 3% in the past year and since reporting commenced in 2017 it has changed minimally from 77% female and 23% male.
Please note these figures exclude bank workers. The remainder of the report includes data pertaining to substantive staff plus any bank workers who worked on 31 March 2024. This is in accordance with the Gender Pay Gap reporting requirements.
In line with gender pay gap reporting we are required to report annually on the following:
- Mean gender pay gap
- Median gender pay gap
- Mean bonus gender gap*
- Median bonus gender gap*
- The proportion of males receiving a bonus payment*
- The proportion of females receiving a bonus payment*
- Proportions of males and females in each quartile of pay band
*Under the regulation payments that would fall under the remit of bonus would include Clinical Excellence Awards for consultants and Long Service Awards.
Mean and Median Gender Pay Gap
The mean gender pay gap and median gender pay gap for all employees is detailed below. Gross pay calculations are used for these purposes.
In line with guidance, only staff on full pay are included in the calculations therefore staff on reduced pay for sickness, maternity or other reasons are excluded. Overtime payments are also excluded from these calculations.
- Mean Gender Pay Gap: Females 10.82% less than males – equating to £2.23 per hour less
- Median Gender Pay Gap: Females 0.00% less than males – equating to £0.00 per hour less
2024 mean hourly pay
- Male: £20.56
- Female: £18.34
- Difference: £2.23
- Gap: 10.82%
2024 median hourly pay
- Male: £17.73
- Female: £17.73
- Difference: £0.00
- Gap: 0.0%
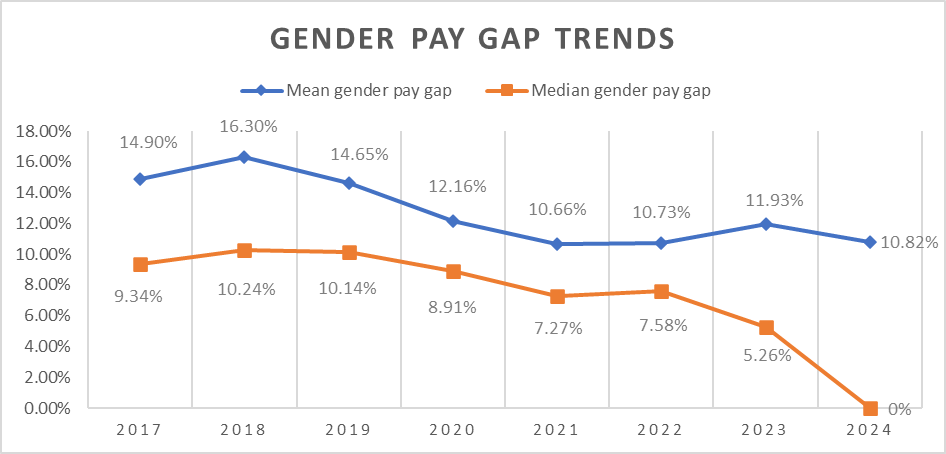
The mean gender pay gap linked to the amount a female is paid has decreased in the past year from 11.91% to 10.82%. From an hourly rate perspective this equates to a mean gender pay gap decrease in the past year from £2.38 per hour to £2.23 per hour less than males.
The median gender pay gap has reduced from 5.26% to 0.00% which from an hourly rate perspective equates to a median gender pay gap change in the past year from £0.91 per hour to £0.00 per hour less than males.
The graph below highlights the mean and median gender pay gap reported figures between March 2017 and March 2024 for comparison purposes.
2024
There are number of possible contributory factors which can influence the gender pay gap differences. The Trust operates a number of salary sacrifice schemes which affords staff the opportunity to purchase vouchers towards childcare costs, purchase a cycle, electrical goods or a lease car.
The costs associated with salary sacrifice schemes are deducted prior to calculating gross pay. This will have an impact on the gross pay calculations undertaken to determine the mean and median gender pay gap and will be one of a number of contributory factors which may be causing the differences being reported.
It is important to note that some staff have more than one salary sacrifice in place (some have up to five) and that amounts of deductions can vary considerably.
2024
| Row Labels | Count of Employee Number | Percentage |
|---|---|---|
| Female | 1263 | 76.9 |
| Male | 380 | 23.1 |
| Grand Total | 1643 | 100.0 |
As you would expect, in line with the gender split within the organisation, the majority of staff opting to participate in one or more salary sacrifice schemes are female (accounting for 76.9% of the salary sacrifices).
Agenda for Change and Very Senior Manager Pay
When medical staff are removed from the calculations, the gender pay gap decreases which is common amongst NHS Trusts. The mean and median gender pay gaps for those staff employed on Agenda for Change terms and conditions and Very Senior Managers (VSM) Pay is detailed below.
- Mean Gender Pay Gap: 1.75% less than males – equating to £0.32 per hour less
- Median Gender Pay Gap: 13.43% less than males – equating to £2.44 per hour less
Comparing this 2024 data with the previous year shows the mean gender pay for staff on AFC & VSM pay has decreased from the previous year of 3.61% to 1.75%. The median gender pay gap has increased from 4.42% to 13.43%.
Mean hourly pay
- Male: £17.97
- Female: £17.65
- Difference: £0.32
- Gap: 1.75%
Median hourly pay
- Male: £18.15
- Female: £15.71
- Difference: £2.44
- Gap: 13.43%
Medical and Dental
The information below highlights the mean gender pay gap and median gender pay gap for those staff employed on Medical and Dental terms and conditions. The figures include the Clinical Excellence Awards payments that are paid to eligible medical staff.
- Mean Gender Pay Gap: 3.70% less than males –– equating to £1.67 per hour less
- Median Gender Pay Gap: 0.01% less than males –– equating to £0.01 per hour less
Mean hourly pay
- Male: £45.07
- Female: £43.40
- Difference: £1.67
- Gap: 3.70%
Median hourly pay
- Male: £52.11
- Female: £52.10
- Difference: £0.01
- Gap: 0.01%
Compared with last year there has been a reduction in the gender pay gap within the medical workforce from both a mean and median calculation. The mean gender pay gap within the medical workforce has decreased from 7.92% in 2023 to 3.70% in 2024. The median gender pay gap has also decreased between male and females in the past year from 3.19% to 0.01%.
Bonus Payments
Under the regulations, payments that would fall under the remit of bonus would include Clinical Excellence Awards for consultants and Long Service Awards.
Clinical Excellence Awards (CEA)
Under the national Medical & Dental terms and conditions consultants are eligible to apply for Clinical Excellence Awards (CEA). These awards recognise individuals who demonstrate achievements in developing and delivering high quality patient care over and above the standard expected of their role and are part of a commitment to the continuous improvement of the NHS.
At the time of reporting the Trust was operating a local clinical excellence award scheme based on the national terms and conditions. For the 2024 award year it was agreed locally that due to industrial action that the Trust would follow the same process as that which took place in the preceding years linked with the pandemic. This meant that the Trust could again stand down the usual formal process of application and review for CEA’s. Instead, the money could be divided equally between all eligible individuals, and they received a non-consolidated and non-pensionable payment for the year. Therefore, everyone received the same amount of award for 2024.
There are also however several individuals receiving historic awards from 2017 which are recurrently paid each year. Once an award had been made the consultant continues to receive that level of award going forward. A further submission may be made the following year and as a consequence progression through the varying payment levels occurred.
As part of the new terms and conditions following agreement to the pay settlement, from 1st April 2024 the contractual entitlement to access annual CEA awards stopped. Therefore, there will be no new award rounds. Any doctor who has a pre-2018 CEA will be retained and remain pensionable and consolidated. The value of these awards will be frozen, and the review process has been removed. These changes will impact on future pay gap reports.
Based on current guidance the table below shows the mean and median bonus pay linked to clinical excellence awards only.
| Gender | Mean Bonus Pay | Median Bonus Pay |
|---|---|---|
| Male | £8,611 | £5,682 |
| Female | £4,835 | £2,666 |
| Difference | £3,776 | £3,016 |
| Pay Gap % | 43.85% | 53.08% |
All of the Trust eligible 114 Consultants received a Clinical Excellence Award in the reporting year. Of which 53 are female and 61 are male eligible consultants.
Whilst there was a generally equal split of males and females receiving Clinical Excellence Awards, overall, there were more males receiving larger monetary amounts due to the historical awards which is evident by the mean bonus gender gap percentage. It is important to note that compared to the Trust gender split, within this staff group there is more even split of male and females.
Comparing this year’s data with 2023, the pay gap for mean bonus payments amounts are relatively unchanged. The median bonus in 2023 was 0%. The change in 2024 is as a result of more males in receipt a higher level of awards.
Long Service Awards
The Trust operates a locally agreed long service award scheme to recognise the service of staff who have 25 years NHS service. The award is a £100 gift voucher. In the reporting period a total of 167 staff received an award. 134 females (80%) and 33 males (20%) received an award.
Under the Regulation we are required to include payments which relate to profit sharing, productivity, performance, incentive or commission should be included in the bonus calculations. It could be argued long service awards do not provide the incentive usually associated with the criteria outlined above. Guidance from ACAS states that such payments with a monetary value should be included in the bonus calculations.
Total Bonus Payments
The table below provides combined details of the clinical excellence awards and long service awards. These figures are very similar to last years.
| Gender | Mean Bonus Pay | Median Bonus Pay |
|---|---|---|
| Male | £5,683 | £2,666 |
| Female | £2,012 | £100 |
| Difference | £3,671 | £2,566 |
| Pay Gap % | 64.59% | 96.25% |
It is important to recognise when combining the bonus awards in this way the data is skewed as long service awards are predominantly paid to women, with a higher proportion of males receiving clinical excellence award payments. These payments are also not prorated.
Overall percentage of males and females receiving bonus payments
Females: 2.9%
Males: 5.5%
The guidance requires us to calculate the percentage of males and females who have received a bonus as a percentage of all employed males and females (not just those on full pay which other aspects of the gender reporting require us to do).
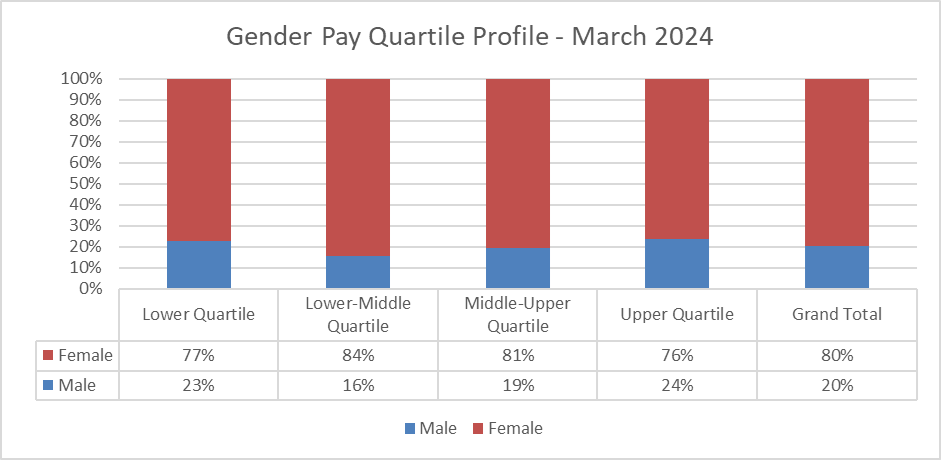
Gender Pay Quartile Profile
The following graph shows the proportion of males and females in each pay quartile. The lower quartile represents the lowest salaries in the Trust and the upper quartile represents the highest salaries. The Trust employs more women than men in every quartile.
The middle-upper quartile in 2024 has shown a decrease in the proportion of females within that quartile from 82% in 2023 to 81% in 2024.
The remaining quartiles have remained broadly the same.
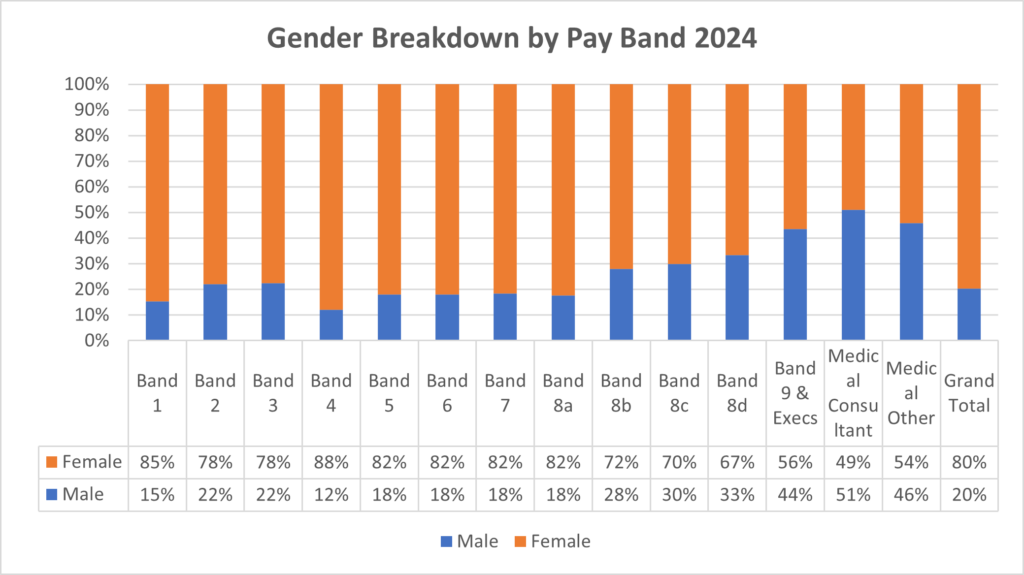
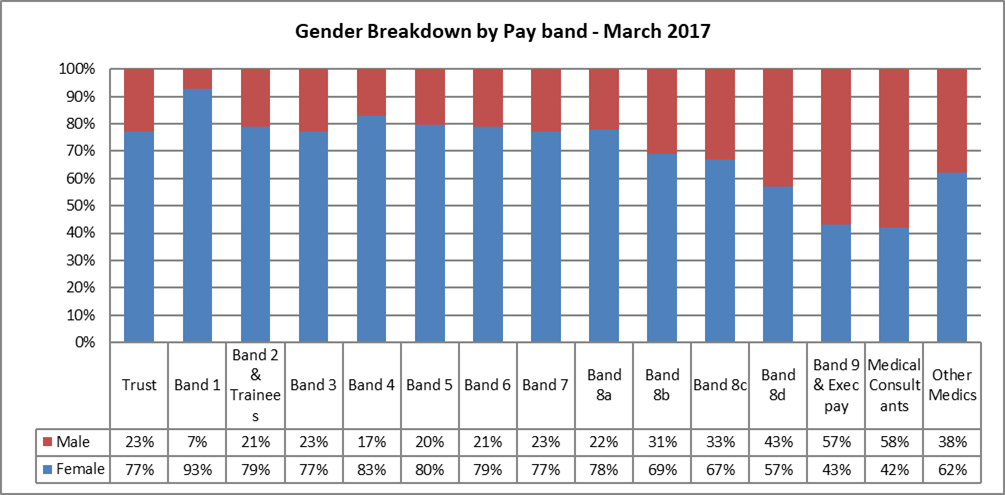
Gender Breakdown by Pay Band
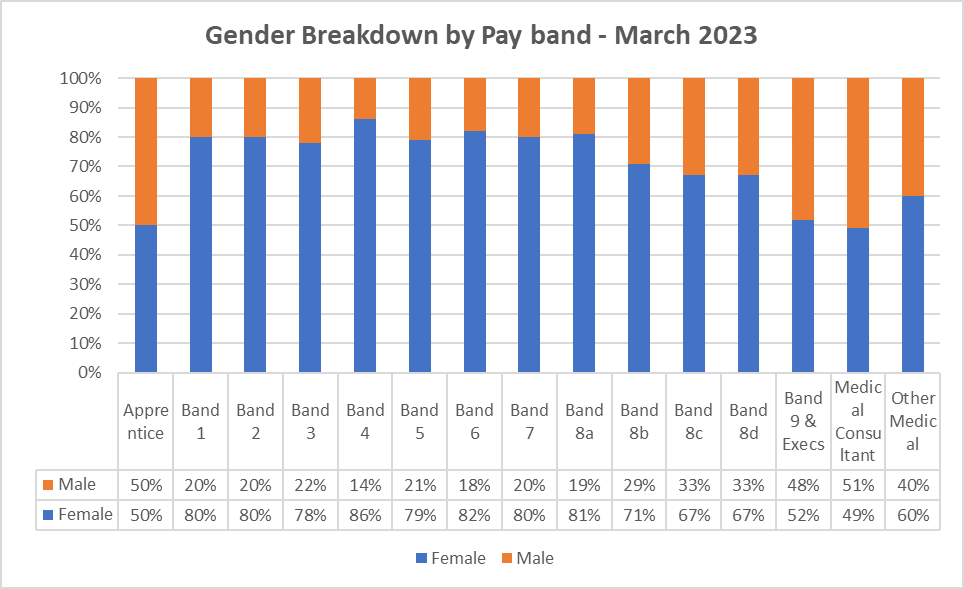
The three graphs below provide a comparison of the Trusts gender profile breakdown by pay band as at March 2024, 2023, and March 2017 when reporting commenced.
The ratio between males and females comparing 2024 and 2023 have shown little change within Band 9 and VSM roles. In 2023, females accounted for 52% of this group whereas in 2024 they account for 56%. Males in this banding have decreased from 48% in 2023 to 44% in 2024.
Comparing data from 2017 with 2024 shows that the proportion of females in bands 8d, 9 & VSM pay and in consultant posts have had the largest increases. Females in 8d posts have increased from 57% to 67% between 2017 – 2024. Band 9 and VSM pay grades have seen an increase in females from 43% to 69% in 2022, this has then reduced in 2024 to 56%.
The female consultant workforce has increased from 42% in 2017, to 49% 2023 and stayed the same in 2024.
Females in other medical grades have seen a slight fluctuation, starting at 62% in 2017 and has reduced to 54% in 2024.
Band 1 was closed to new entrants from 1 December 2018, therefore the number of overall staff in this banding will continue to reduce as people leave the role. Currently there are 13 staff employed in Band 1 roles.
2024
2023
2017
Key Findings:
- The mean and the median pay gap have reduced from 2023.
- The overall median gender pay gap has decreased since last year from 5.26% to 0.00%.
- The ratio between males and females comparing 2024 and 2023 have shown little change within Band 9 and VSM roles. In 2023, females accounted for 52% of this group whereas in 2024 they account for 56%. Males in this banding have decreased from 48% in 2023 to 44% in 2024.
- Comparing data from 2017 with 2024 shows that the proportion of females in bands 8d, 9 & VSM pay and in consultant posts have had the largest increases. Females in 8d posts have increased from 57% to 67% between 2017 – 2024. Band 9 and VSM pay grades have seen an increase in females from 43% to 69% in 2022, this has then reduced in 2024 to 56%.
- There has been a decrease in the mean gender pay gap from the previous year of 3.61% to 1.75% however the median gender pay gap has increased from 4.42% to 13.43% for staff in AFC & VSM pay grades.
- Whilst there were relatively equal numbers of males and females receiving clinical excellence awards, overall, there were more males receiving larger monetary amounts which is evident by the mean bonus gender gap percentage. This is likely to be a result of the historical awards that some consultants hold.
Proposed Areas for Further Action Specific to the Gender Pay Gap Report:
- To review how changes to the Clinical Excellence Awards impact on the gender pay gap.